








Drowning In Inventory Data? Here Is What Is ABC Analysis And How It Saves Your Warehouse Sanity
22 August 2026
8 Mins Read
- What Is ABC Analysis?
- · 'A' Items (The VIPs)
- · 'B' Items (The Middle Class)
- · 'C' Items (The Essentials)
- Structuring Your Strategy: The 80/20 Rule
- Why Should You Even Bother with ABC Analysis?
- Choosing The Right Model: Simple vs. Complex
- The Simple Analysis: Single-Dimensional Examination
- The Complex Analysis: Multi-Dimensional Examination
- Picking Your Metric Cheat Sheet
- 5 Simple Steps To Run Your ABC Analysis
- Step 1: Prepare Your Data
- Step 2: Sort The Numbers
- Step 3: Calculate The Percentage Impact
- Step 4: Group Items Into Categories
- Step 5: Level Up To Multi-Dimensional Analysis (Optional)
Buyers are always drowning in work. Between handling part shortages and trying to cut inventory costs, there is never enough time. When managing thousands of parts and dozens of suppliers, your team needs a smart way to focus on what matters most.
That is exactly what is abc analysis and why it helps. Think of it as a simple tool that sorts your inventory into three buckets based on cost and importance. Instead of stressing over every single item, your team can easily prioritize the high-impact parts first. As a result, you save time, reduce stress, and keep your budget perfectly on track.
| Quick Overview: What is ABC Analysis? What is ABC analysis? It is a simple inventory management technique based on the Pareto Principle (the 80/20 rule). It helps businesses maximize efficiency by sorting stock into three distinct buckets based on total value and importance: · Category A: High-value items. These make up about 70-80% of total inventory value but only 10-20% of physical stock. They require tight control. · Category B: Moderate-value items. These represent roughly 15-20% of value and 30% of stock. They need regular monitoring. · Category C: Low-value items. These account for just 5% of value but make up 50% of stock. They require minimal oversight. Ultimately, this system allows busy buyers to automate low-risk decisions and focus their limited time on high-impact inventory. |
What Is ABC Analysis?

Let’s face it, not all parts in your warehouse are created equal. Some components cost a fortune, while others are used constantly.
Then, you have those tricky items that hit you with a double whammy, they are both expensive and moving fast.
Since you cannot give 100% of your focus to every single part, you need a smart way to clear the noise. That is where understanding what is abc analysis comes in handy.
Essentially, this system acts like a filter, sorting your inventory into three simple buckets:
· ‘A’ Items (The VIPs)
These are the most critical parts you own. Because they have a super high usage rate, a hefty price tag, or both, they deserve your full attention.
· ‘B’ Items (The Middle Class)
These parts sit comfortably in the middle. They do not cost as much as your ‘A’ items, making them slightly less critical, but they still require a steady, watchful eye.
· ‘C’ Items (The Essentials)
Think of these as the loose change in your pocket. Interestingly, you will have a massive number of ‘C’ items taking up physical space in your warehouse.
However, they barely make a dent in your overall budget.
Structuring Your Strategy: The 80/20 Rule
To make this concept even easier to digest, we can look at a famous business principle known as the Pareto Principle (80/20 rule). In manufacturing, this rule shows us that roughly 80% of your total inventory costs come from just 20% of your items.
If you want to set up an optimal system, data from supply chain experts suggests looking at the numbers this way:
- ‘A’ items: They represent 80% of your annual inventory value, but only make up about 20% of your physical stock.
- ‘B’ items: They account for 15% of your annual value and take up about 30% of your warehouse space.
- ‘C’ items: They take up a tiny 5% of your annual budget, even though they represent a whopping 50% of your actual items.
A quick side note for manufacturers: You might already be familiar with a similar tool called RRS Analysis—which stands for Runner, Repeater, and Stranger.
If you want to compare the two, your “Runners” are your ‘A’ items, your “Repeaters” act as your ‘B’ items, and those unpredictable “Strangers” are your ‘C’ items.
Why Should You Even Bother with ABC Analysis?

You get a revealing insight into your business’s current state by performing this diagnostic.
With the information you receive, you will be able to make smart decisions and save money on inventory management, as well as offer better service and higher profits.
You can gain a number of significant benefits by understanding what is abc analysis and how it can be applied to your own business. This includes:
- Directing more resources to category A and reducing expenditures on category C
- Reducing the amount of manual work required to maintain optimal stock levels of low-value goods
- Being able to anticipate and prevent shortages of critical inventory items instead of always putting out fires.
It is essential to utilize the power of this diagnostic tool to ensure that your time and effort are well spent maintaining stock levels.
You and your management team should spend some time considering what it is you hope to accomplish before calculating any values.
You may need to use different criteria to sort your inventory. This depends on your particular set of goals.
For example, consider the following questions and answer them to the best of your ability:
- Do you need to identify your most important items?
- Do you need to determine your most valuable customers?
- Is there a need to optimize your warehouse?
The type of information you wish to obtain with your ABC analysis will dictate the method of computation.
You will have several options to choose from. This depends on the information you wish to extract from your inventory,
Related Article For You: Stop Wasting Money On The Wrong Stock: The 3-Step VED Analysis Trick That Saves Crashing Businesses!
Choosing The Right Model: Simple vs. Complex
Now that you have established what you want to achieve, think about the level of detail you need.
Do you need a simple analysis that will give you general insight, or do you need a more in-depth examination?
Depending on your needs, a simple analysis can help you get fast results that are easy to understand.
At the same time, a more complex approach will allow you to have a more precise perception of your business processes.
The Simple Analysis: Single-Dimensional Examination
Let’s say you have just opened a l, and your primary goal is to identify the most popular items to place them in the most accessible part of the warehouse.
In this case, you will most probably need a single-dimensional analysis.
You will need to choose the most critical indicator for you (for example, the total turnover of goods or the number of order lines) and examine your inventory based on that indicator.
The analysis will be very simple: you only need to sort your goods based on the selected indicator in descending order.
The Complex Analysis: Multi-Dimensional Examination
However, sometimes one indicator is not enough. Let’s say, in addition to the most popular items, you want to identify the goods that bring you the most profit so that your planners could focus on them.
In this case, you will need a more complex analysis that will allow you to examine your inventory based on two or more indicators. Such analysis is also called an ABC-XYZ analysis.
An example of an analysis with two dimensions is presented below:
- Profitability
- Total turnover (or the number of order lines)
As you can see, you can base the analysis on completely different indicators. The critical point is that the analysis will allow you to examine your inventory from several perspectives at once.
For example, you may find that a particular product has a low level of profitability, but at the same time, a large number of customers buy it.
This information will be helpful to you: if many people buy your product, but it does not bring you much profit, you will need to consider this in your pricing policy.
Such analysis is much more complex than single-dimensional analysis, but it provides much more information and helps you see the bigger picture.
Picking Your Metric Cheat Sheet
There are plenty of data points you can use to run your numbers. The secret is picking the ones that match your current business goals. Here is a quick breakdown of what different metrics reveal and why they matter:
| What You Measure | What the Data Actually Tells You | Why It Matters for Your Business |
| Sales Volume | How much total revenue a specific product brings in. | Helps you instantly spot which products sell in the highest quantities. |
| Gross Margin | How much profit a product makes after subtracting what it cost to buy or build. | Shows you exactly which items are generating the raw cash flow. |
| Net Margin | The true profit left over after absolutely every single hidden cost is paid. | Identifies the heavy hitters that have the biggest final impact on your bottom line. |
| Number of Customers | Whether a part is bought by dozens of people or just one major client. | Helps you see your risk. If only one client buys a part and they leave, your demand crashes. |
| Number of Orders | Whether your demand comes from one giant bulk order or lots of small, frequent orders. | Tells you how often your team has to pick, pack, and ship a specific item. |
5 Simple Steps To Run Your ABC Analysis
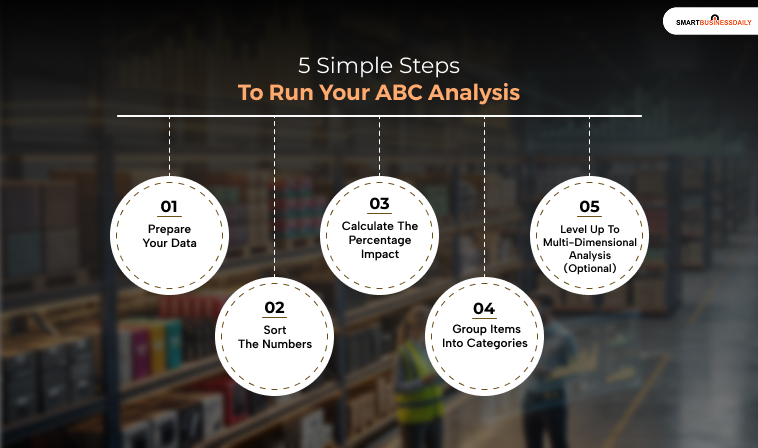
While businesses use slightly different approaches, a standard analysis relies on 5 core steps.
To see how this works in the real world, let’s run a sample analysis using profit margin as our main metric.
Step 1: Prepare Your Data
Before crunching numbers, pull a clean data report from your system. Extract your chosen metric at an item (SKU) level over a specific timeframe. For this walkthrough, we are pulling the total margin generated by each individual item.
Step 2: Sort The Numbers
Take your raw data and rank your items from highest to lowest based on your chosen metric.
In the example below, the list is sorted in descending order by the total dollar margin each product brings in.
| Item Number | Item Description | Profit Margin |
| 00034 | Drilling machine | $90 |
| 56782 | Workbench | $72 |
| 67421 | Outdoor paint | $21 |
| 56432 | Indoor paint | $10 |
| 10134 | Glue | $9 |
| 12543 | Screwdriver | $6 |
| 32567 | Extension cord | $6 |
| 00012 | Multispray | $5 |
| 93003 | Insulation | $4 |
| 88973 | Screws 10x | $2 |
| 10239 | Bolts 10x | $1 |
| 32356 | Nails 25x | $1 |
Step 3: Calculate The Percentage Impact
Next, figure out how much weight each individual product carries.
- Find individual percentage: Divide each item’s margin by the total overall margin of all your stock combined.
- Find running total: Start at the top of your sorted list and add up the percentages as you move down to create a running cumulative percentage.
Step 4: Group Items Into Categories
Using those running percentages, draw the lines for your final buckets. Here is the standard industry breakdown:
- Category A (Top 80%): The heavy hitters driving the vast majority of your value.
- Category B (Next 15%): The steady middle class that brings in moderate value.
- Category C (Final 5%): The low-value items that make up the tail end of your budget.
When you apply these boundaries to our sorted list, your data instantly self-organizes:
| Category | Item Number | Item Description | Margin | Why It Matters |
| A | 0003456782 | Drilling machineWorkbench | $90$72 | The VIPs: These two items carry the highest impact on your margin. Keeping them consistently stocked to meet customer demand is a top priority. |
| B | 67421564321013412543 | Outdoor paintIndoor paintGlueScrewdriver | $21$10$9$6 | The Mid-Tier: Important products that need steady monitoring, but don’t require daily micromanagement. |
| C | 325670001293003889731023932356 | Extension cordMultisprayInsulationScrews 10xBolts 10xNails 25x | $6$5$4$2$1$1 | The Bulk Stock: High in physical volume but low in financial impact. You can safely automate these reorders to save time. |
Step 5: Level Up To Multi-Dimensional Analysis (Optional)
If you want a more detailed view instead of looking at just one metric, you can easily upgrade to a multi-dimensional, or ABC-XYZ analysis.
To do this, simply repeat steps 1 through 4 using a completely different second metric, like sales frequency or customer order volume. By layering these two sets of results over each other, you can instantly see what ABC analysis is truly capable of, revealing hidden patterns like items that have low margins but are bought by your most loyal customers every single week.
Additional Resource: Ecommerce Strategy Breakdown: Advanced Marketing Techniques




Related Articles